Alternative Revenue Mechanisms
- Alternative Revenue Mechanisms for the Roadway System (November 2023)
- Research Brief (January 2024)
- Article: States explore fee alternatives to fund roadway infrastructure (March 2024)
EV Charging Infrastructure
- Distribution of Electric Vehicle Charging Infrastructure in Minnesota (2026)
- Electric Vehicle Charging Stations at Gas Stations in Minnesota (October 2025)
Motorization Trends in Minnesota
Minnesota Roadway Funding
- Transportation Policy Changes Introduced in the 2025 Legislation in Minnesota (December 2025)
- Minnesota Roadway Funding Revenue Sources & Distribution (November 2024)
- Research Brief (January 2025)
- Minnesota Roadway Funding Revenue Sources & Distribution (July 2020)
Minnesota Transportation Funding Redistribution Reports
Analyses
Redistribution of Transportation Funding across Minnesota
April 10, 2018
Transportation funding comes from all levels of government – the federal government, the state government, and local governments that include counties, cities, and townships. The redistribution of transportation funding arises the following questions: What areas contribute the most to transportation funding? What areas receive more funding? What areas contribute more than what they receive? Or verse versa. This report aims to answer these empirical questions with the purpose of facilitating informed decision making.
In this report, we aggregate or allocate data to the county level for analysis and then present the aggregated results at the district level for a six-year period, between 2010 and 2015. We found that local governments fund a huge proportion of the transportation infrastructure in Minnesota, primarily through the property taxes they collect. The Twin Cities metro district contributes slightly more than what it receives. In addition, this district receives the largest share of funding for transit services. Districts in Greater Minnesota receive more funding that they contribute, mainly due to lower population density. Finally, we found a cost of 7 cents per vehicle mile traveled in the state. This cost tends to be much higher in counties located in the north.


Minnesota transportation funding: How are federal, state dollars redistributed?
May 12, 2017
Transportation funding comes from all levels of government—federal, state, and local. Funding that is directly generated by local taxes and fees stays in corresponding local jurisdictions (counties, cities, and townships, for example). Federal and state transportation funding, however, is allocated through certain budgetary procedures and may not be used in the original point of collection. How are these transportation funds redistributed in Minnesota? An analysis from TPEC researchers offers new perspectives.
For the study, which looked at the six-year period between 2009 and 2014, the researchers analyzed funding revenues and expenditures at the district level for both roadways and transit. The researchers chose this approach for several reasons. Federal and state transportation grants to local governments are often distributed to transportation districts before they are used in different counties. In addition, the approach smooths out annual fluctuations associated with transportation grants to individual counties.
The analysis included three steps. First, the researchers calculated the share of transportation revenues contributed from different localities. Second, they examined the share of federal and state transportation expenditures across different localities. Third, they compared the expenditure share and the revenue share for each district to see what areas contribute more than they receive, or vice versa.
When both roadways and public transit are included, the findings indicate that the Metro district contributes about 48 percent of federal and state transportation revenues and receives about 51 percent of federal and state transportation expenditures. However, the expenditure-to-revenue ratio changes when roads and transit are separated. Metro counties receive about 88 percent of transit funding but 36 percent of highway funding.
Other districts show different patterns. For example, District 2 and District 1 receive more than they contribute, mainly because they receive a higher share of road expenditures than they contribute to road revenues. District 3 receives less than it contributes.
Read a paper summarizing the analysis (PDF).
Transportation spending: How does Minnesota compare with other states?
March 15, 2017
Is Minnesota spending enough, too little, or too much on transportation? One way to help answer that question is to compare spending with other states. A simple comparison, however, may not accurately reflect the real level of transportation funding across the states. States face different levels of demand and costs due to different geographic, demographic, or labor market conditions.
To better understand the factors that influence the transportation funding level, TPEC researchers developed a cost-adjusted approach to systematically compare highway expenses among states. The approach controls for the effects of some major cost factors, such as demographics and natural weather conditions, which are outside of the control of state and local officials.
The analysis found that natural weather conditions have a significant impact on highway spending—a lower winter temperature is associated with higher highway expenditures. The effect of population size isn’t as straightforward: There is some impact of economy of scale, but only to a certain threshold.
The analysis also found that state and local governments tend to spend less on highways when they are under fiscal stress, and states with a higher gross domestic product (GDP) appeared to spend more on highways per capita. Essentially, highway investment decisions may be greatly influenced by the economic fluctuations and fiscal stresses faced by a state.
According to unadjusted 2010 data, Minnesota ranks 8th on highway spending per capita and 18th on its share of statewide highway spending in GDP. But after adjusting for those factors that are largely out of control by transportation policy, Minnesota’s rankings drop to 37th on highway spending per capita and 41st on the share of highway spending in GDP.
Local transportation spending in Minnesota cities
September 11, 2015
How do Minnesota cities compare to each other in local transportation expenditures? Figure 1 maps per capita transportation expenditure of 100 Minnesota cities with population around or larger than 10,000 in FY2010. According to governmental fund data provided by the State Auditor Office, most cities spent about $100-$400 per capita in the year, but there are several cities that spent less than $100 and other higher than $500.
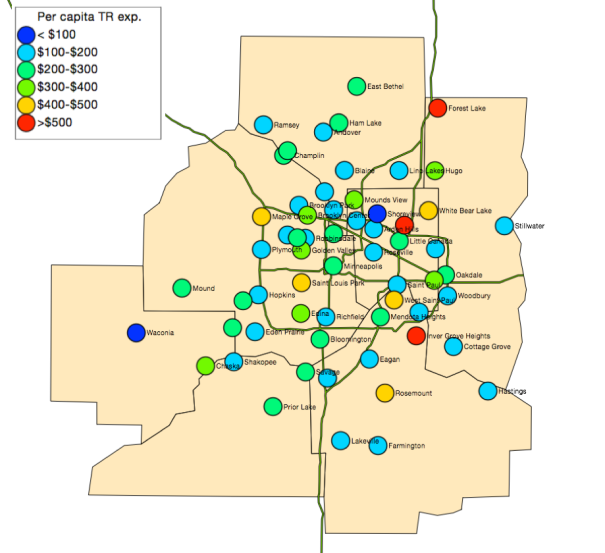
Figure 2 zooms in and shows only those cities in the Twin Cities metro area, where, interestingly, we see variations at both ends. Three cities — Forest Lake, Arden Hills, and Inver Grove Heights – were the top spenders on local transportation improvements, while two cities – Shoreview and Waconia – seemed to spend much less than the average.
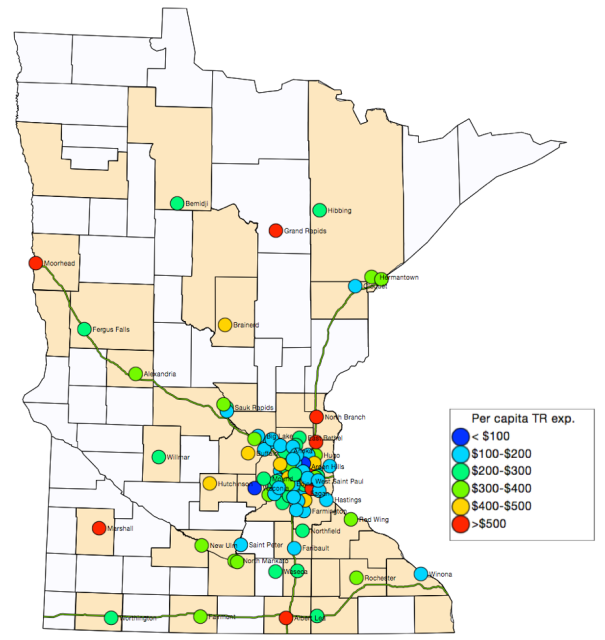
Figure 1: Per capita transportation expenditure of Minnesota Cities (Pop>10,000)
Note that we cannot rush to conclusions with such simple comparisons. GIS analysis helps us visualize and identify patterns that may worth further probing. Like other big-item capital outlays, transportation spending in a locality tends to fluctuate over time and is significantly affected by many external factors, for example, the scale of economy, population growth, population density, and current road conditions. More research will be needed to understand what affects the need, the capacity, and the effort of local transportation investment across cities.
More data about transportation expenditures in Minnesota cities (1986-2011) are available through the Minnesota Transportation Finance Database (Data H).
Taking Stock of Minnesota’s Long-term Transportation Investment
August 11, 2015
What matters in transportation improvement is not just the money spent in one single year, but also the accumulated amounts invested over a long period of time. With data available through the Minnesota Transportation Finance Database, Jerry Zhao develops two measures of long-term accumulated transportation capital stocks in Minnesota counties during the period of 1995-2011, taking into consideration annual spending, depreciation, and the fluctuation of highway construction costs.
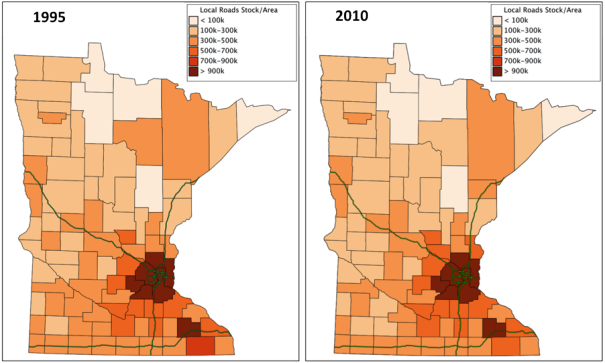
One transportation capital stock is related to local road investments incurred by the counties, and the other about trunk highway construction and maintenance administered by MnDOT within each county. Figure 1 and Figure 2 shows two snapshots of the stocks, respectively, in 1995 and 2010. We can visualize how each stock changes over time, and also compare the size of two different stocks since the figures are prepared in the same scale.
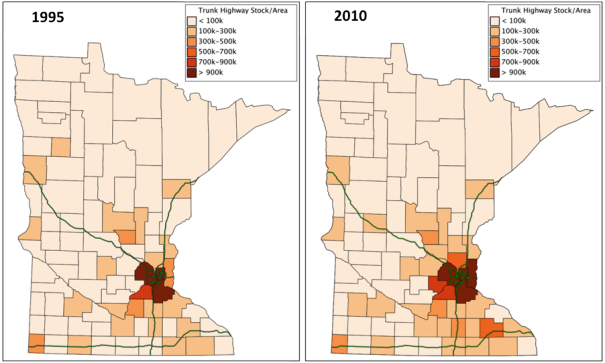
For details about the two measures, see a recently published CTS research report: Transportation Investment and Economic Development in Minnesota Counties. The report finds that investments in local roads and trunk highways show positive returns in property tax values in Minnesota counties.
The complete data about the research is available, including the two transportation capital stocks. With the complete information about the two stocks at the county level during 1995-2011, a county could develop a historical view about the trends of transportation development within the county, and then compare the stocks to those of other counties, which could be neighboring counties or others that are considered comparable or competing peers.
Has Motorization in Minnesota Peaked?
May 19, 2015
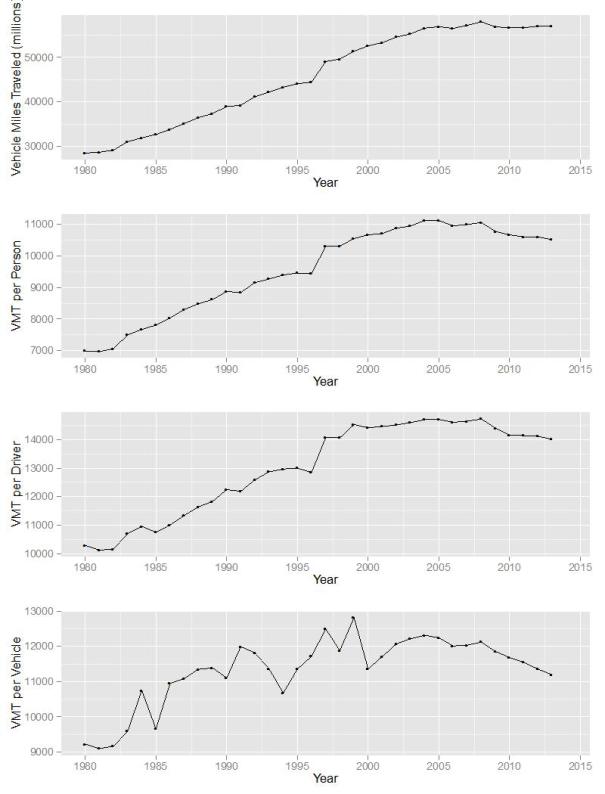
The graph above shows motorization trends in Minnesota during 1980-2013. The four panels are about VMT (Vehicle Miles Traveled), VMT per person, VMT per registered driver, and VMT per vehicle, respectively.
As we can see in Panel 1, the year 2006 saw the first VMT annual decrease in the past four decades, and then the travel volume climbed back again in the next two years. Starting from 2009, however, VMT decreased once again and has stayed essentially flat since. While it is too early to conclude, it is likely that the motorization has peaked in Minnesota since 2008.
Other panels suggest even clear downward trends in recent years. VMT per person, VMT per registered driver, and VMT per vehicle have all declined significantly since 2008. Population growth, increased number of drivers, and increased registered vehicles seem to slow down the decrease of VMT in Minnesota, but these factors are not strong enough to reverse the overall VMT trend, consistent with the national pattern.
More data about Minnesota motorization trends (updated to 2013) are available through Minnesota Transportation Finance Database.
Local Efforts Account for the Largest Share of MN Roadway Expenses
May 14, 2015
Many people think that roadway expenses are mainly paid by transportation special revenues in particular federal and state fuel taxes. In fact, local property tax has been the largest single source of transportation revenue in Minnesota.
With 2010 data, our analysis shows that local efforts (mostly with property tax) account for 65% of total local road expenses across cities, townships, and counties in Minnesota. For the whole roadway system including state trunk highways and local roads, the share of local efforts would be about 52%, while the remaining 48% comes from federal and state special revenues. State fuel taxes, in particular, only accounts for about 16% of the whole funding scheme (see the chart below).
Some of these findings are quoted in a recent Pioneer Press editorial, Minnesota: Good Questions about Road Costs (Patricia Effenberger, 5/2/2015). Professor Jerry Zhao notes that, with the Minnesota Transportation Finance Database, we now have better data to provide such analysis to facilitate informed decision-making.

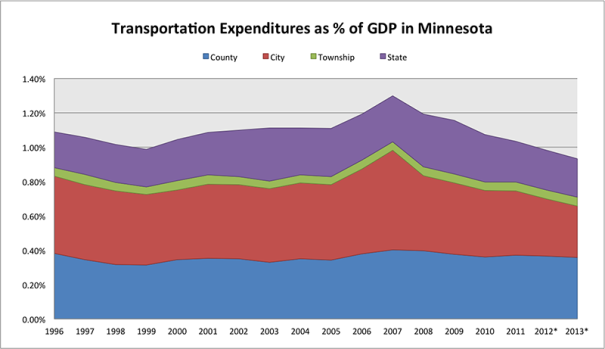
Transportation Expenditures as % of GDP in Minnesota
February 24, 2015
This figure shows the relative size of direct transportation expenditures, across levels of government, as a share of annual GDP in Minnesota. The measures are direct expenditures: state transportation expenditure includes federal transportation grants to the state but not grants that are allocated to local governments; local transportation expenditures include not only local transportation efforts, but also transportation grants they receive from the federal or state government. The figure shows that the shares have been decreasing significantly since 2007. (Note: Data for 2012 and 2013 are predicted based on the 2007-2011 trend.)
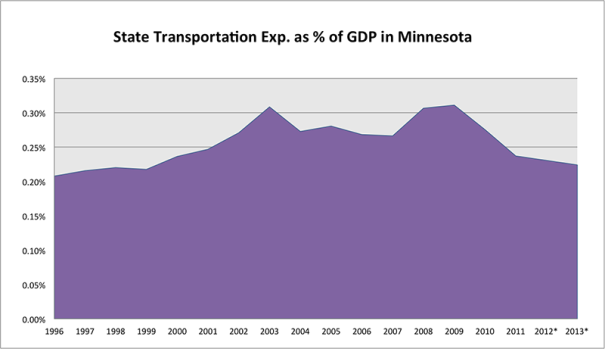
State Transportation Expenditures as % of GDP in Minnesota
February 11, 2015
This figure shows state direct transportation expenditure as a share of GDP in Minnesota.
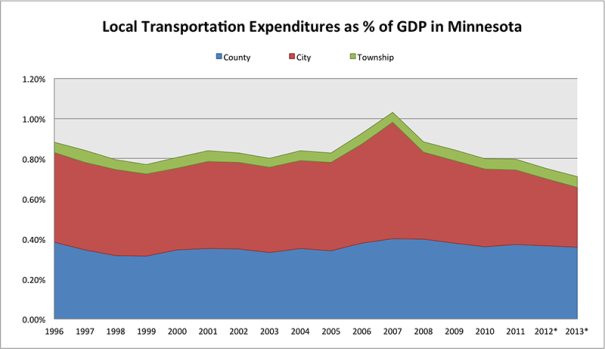
Local Transportation Expenditures as % of GDP in Minnesota
February 5, 2015
This figure shows local direct transportation expenditures, at the county, city, and township level, as a share of GDP in Minnesota.
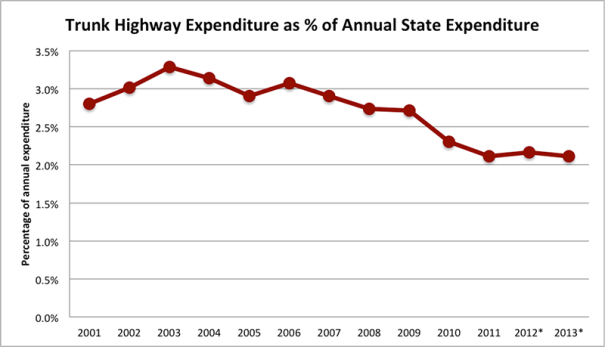
Trunk Highway Expenditure as % of Annual State Expenditure
February 1, 2015
This figure shows the annual trunk highway construction and maintenance cost as a share of annual state expenditure. It has been decreasing significantly since 2006. (Note: Trunk highway expenditures for 2012 and 2013 are predicted based on the 2007-2011 trend.)
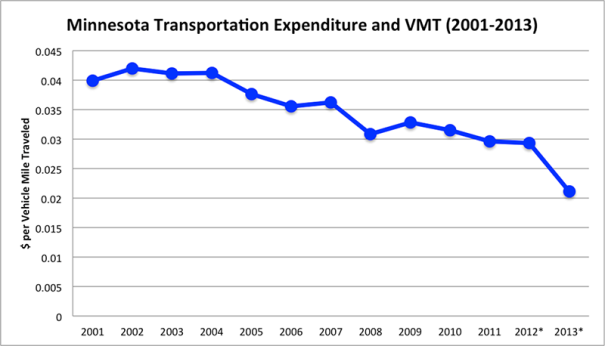
Minnesota Transportation Expenditure and VMT (2001-2013)
January 26, 2015
This figure shows annual transportation expenditures in Minnesota (adjusted with Minnesota Highway Construction Cost, base year = 2000), the total across levels of government, divided by annual vehicle miles traveled (VMT) in Minnesota. (Note: Transportation expenditures for 2012 and 2013 are predicted based on the 2007-2011 trend.)
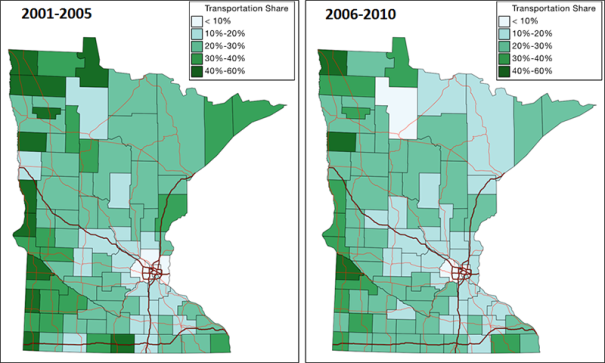
Minnesota County Transportation Expenditure Share
January 15, 2015
This figure shows county transportation expenditure share in two different periods, 2001-2005 and 2006-2010. The expenditure share is measured by dividing annual county transportation expenditure by total annual county expenditure. We use the five-year average to smooth out annual fluctuations in transportation capital outlays.